
In a move that has piqued the interest of the crypto community, an ancient Ethereum whale has transferred a substantial 7,000 ETH, worth approximately 24 million US dollars, to the crypto exchange Kraken. This whale, dormant since the Ethereum Initial Coin Offering (ICO) in 2015, has a history dating back to when a single Ether could be purchased for a mere $0.311.
The Transaction and Its Implications
The whale’s decision to move such a significant amount of ETH has sparked curiosity and speculation within the crypto world. This transaction, valued at around 24 million US dollars, marks a significant event due to the whale’s long period of inactivity. The ETH market has seen a notable price increase in recent weeks, with ETH currently trading at $3,470, up 47 percent since the beginning of the year. It is likely that the whale aims to capitalize on this price surge by taking profits.
Despite this large movement, the whale still holds a substantial 40,000 ETH, currently valued at approximately 140 million US dollars. This investor originally acquired 254,900 ETH during the Ethereum ICO for a total cost of just $79,200, reflecting an astonishing return of 1,115,600 percent in US dollar terms.
Market Reactions and Potential Impact
The transaction has not only stirred excitement within the Ethereum community but also raised concerns about potential market implications. Large movements of ETH by early investors can influence price dynamics and contribute to market volatility. Historically, significant transfers by whales are often perceived as bearish signals, indicating potential sell-offs that could impact the market.
Adding to the current excitement, another Ethereum whale recently emerged after a nine-year hiatus, transferring 8,518 ETH, worth 32 million US dollars, to Kraken. Such significant movements are closely watched as they often precede market shifts.
Positive Signals Amidst Concerns
While large transactions by early investors can be seen as negative indicators, there are also positive signs in the market. One such positive trend is the increasing shortage of Ethereum on crypto exchanges. This scarcity could support higher prices as demand outstrips supply.
Detailed Explanation of the Chart
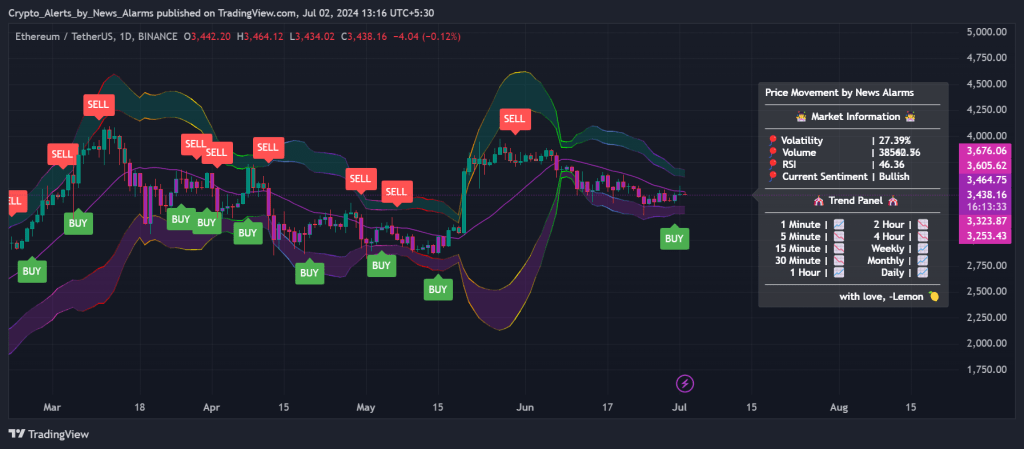
Candlestick Chart
- Candlesticks: Each candlestick represents the price movement of Ethereum (ETH) over a specific timeframe (in this case, daily). The body of the candlestick shows the opening and closing prices, while the wicks (or shadows) indicate the highest and lowest prices during that period. A green candlestick indicates a price increase, while a red one indicates a price decrease.
Bollinger Bands
- Bollinger Bands: These consist of three lines. The middle line is a moving average, and the outer lines are standard deviations away from this average. When the price moves closer to the upper band, it indicates that the asset might be overbought. Conversely, when it moves closer to the lower band, it might be oversold. The width of the bands also indicates market volatility; wider bands mean higher volatility.
Buy and Sell Signals
- Annotations: The chart has several ‘BUY’ and ‘SELL’ signals marked. These signals are generated based on specific trading algorithms or strategies. For example, a ‘BUY’ signal might be triggered when the price crosses above a certain moving average, while a ‘SELL’ signal might be triggered when it crosses below.
Price and Time Intervals
- Price Movement: The right side of the chart shows numerical values corresponding to different time intervals (e.g., 1 minute, 5 minutes, 1 hour, daily). This helps traders understand recent price changes over these intervals.
Additional Indicators
- Volume: The volume bars at the bottom of the chart show the amount of ETH traded during each timeframe. Higher volume often indicates stronger price movements.
- RSI (Relative Strength Index): This is a momentum oscillator that measures the speed and change of price movements. An RSI above 70 typically indicates that the asset is overbought, while an RSI below 30 indicates that it is oversold.
- Current Sentiment: The chart indicates a bullish sentiment, suggesting that traders are generally optimistic about ETH’s price movement.
Ethereum Price Prediction
Predicting the exact price of Ethereum is challenging due to the volatile nature of cryptocurrencies. However, based on the current chart analysis and market sentiment, here are some factors to consider:
- Market Sentiment: The chart indicates a bullish sentiment, which could suggest a potential upward movement in the near term.
- Technical Indicators: If the price continues to stay above the moving average and within the upper Bollinger Band, it could indicate a sustained uptrend.
- Volume and RSI: High trading volume and an RSI that is not in the overbought territory can support further price increases.
Potential Price Levels
- Short-term: If the bullish sentiment continues, ETH could test resistance levels around $3,500 to $3,600.
- Medium-term: Sustained bullish momentum could push ETH towards $4,000 and beyond.
- Long-term: Factors such as broader market trends, regulatory developments, and technological advancements in the Ethereum network will play a significant role in determining its price.
Remember, cryptocurrency investments are highly speculative and can be very volatile. It’s always a good idea to do your own research and consider consulting with a financial advisor.
