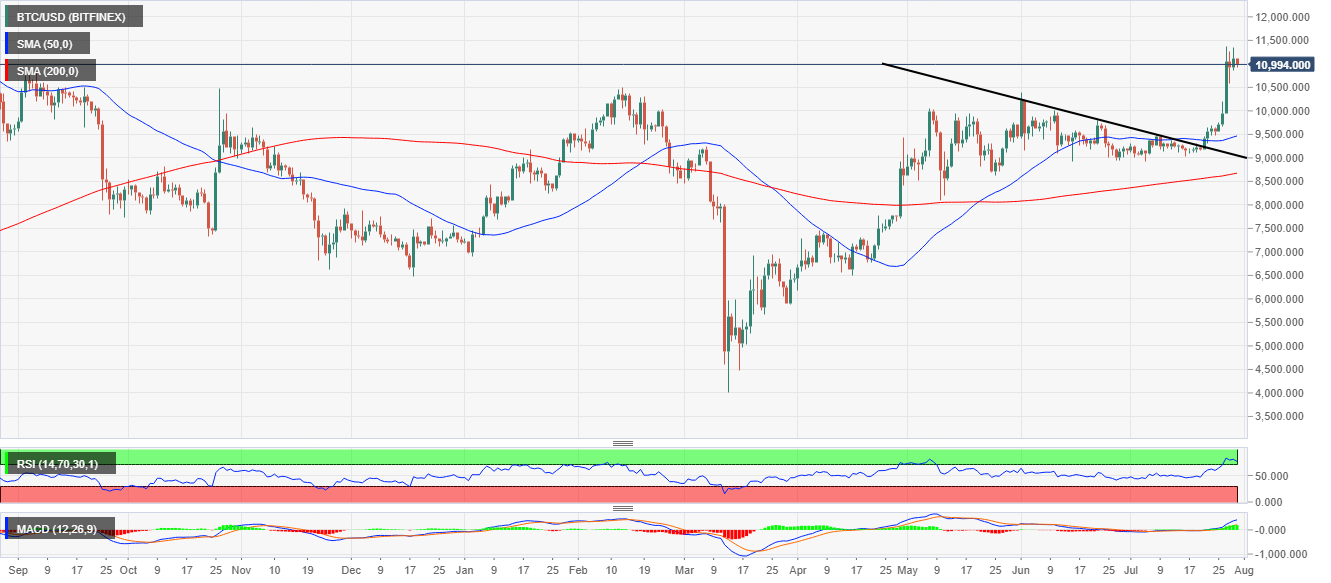
It is often said, “what goes up must go down”, at least in physics. For the cryptocurrency market, the cherished rally in the past few weeks is taking a step back. This is evidenced by a drop in Bitcoin price from Wednesday’s high in Japan at $ 11,361.
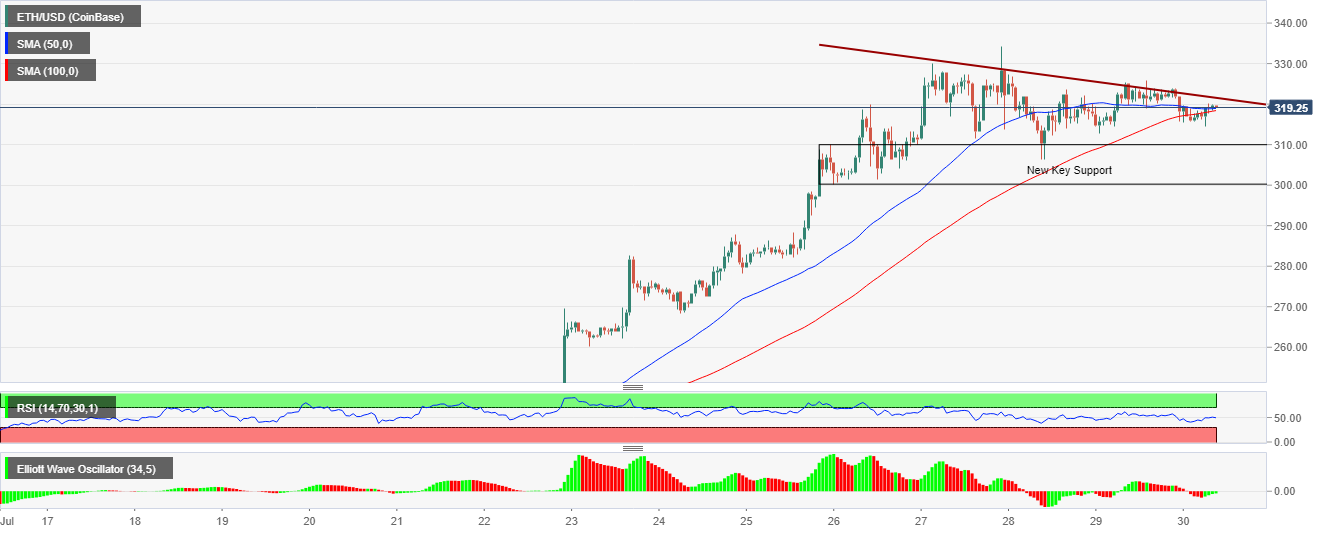
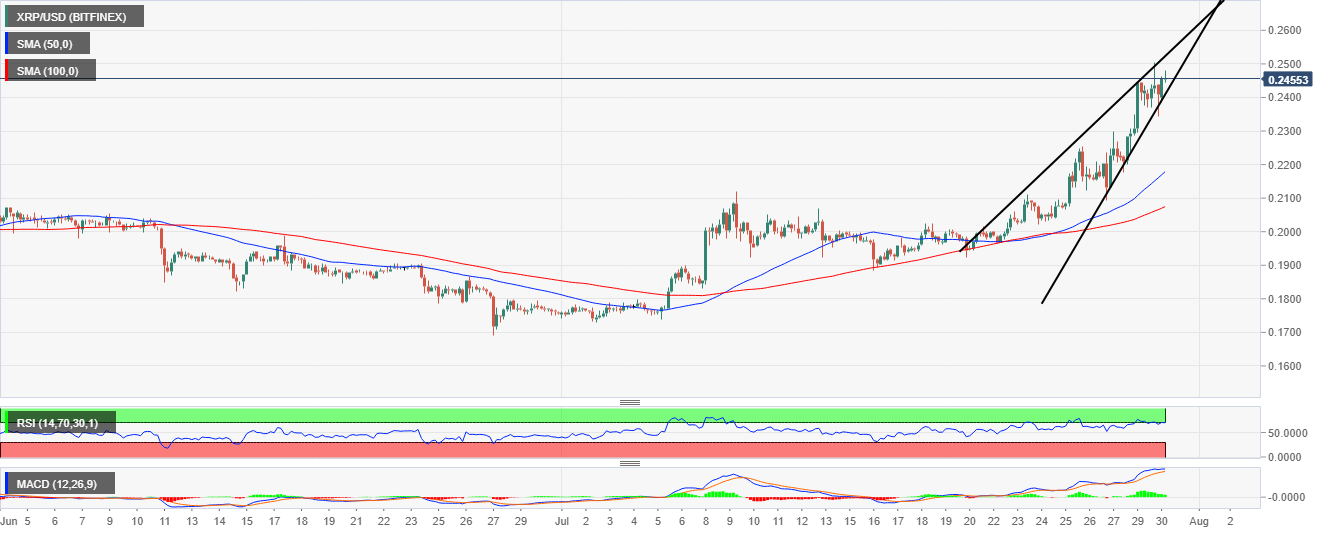
On the other hand, Ethereum has slipped below $ 320 just to confirm support of $ 314. The fourth largest cryptocurrency, XRP has dropped from its new high in July at $ 0.25 to an intraday low of $ 0.2347. XRP is at $ 0.2454 amid a push for another attack towards $ 0.25.
Editorial Top Picks
- A Beginners Guide to Ethereum Trading Price Prediction 2020-2025
- Best Crypto Wallet to Watch in 2020-2021
Short-term analysis of Bitcoin
Bitcoin is trading at $ 10,994 as the bulls focus on pushing the price above $ 11,000. The prevailing technical picture is a downtrend with the RSI going down. If the short-term support at $ 10,900 fails to hold, a major decline is expected to reach $ 10,500.
On the positive side, the MACD indicator is holding well in a positive area, which means that buyers have not completely disappeared and can still buy back the trend above $ 11,000.
BTC / USD chart by date

Ethereum short-term analysis
Ethereum withdrew from the new 2020 high of $ 334. Prices continue to narrow below a descending trend line. On the other hand, the main support has been confirmed in the range of $ 300 to $ 310. ETH / USD currently holds above 50 short-term SMAs while 100 SMAs within 1 hour are suitable for providing support at $ 318.55. The price is trading at $ 319 when buyers push profits above $ 320. A breakout of the resistance of the trendline will pave the way for the next action above $ 330 and finally test $ 350.
4-hour chart ETH / USD

Analyze the price chart of Ripple
Ripple has acted strongly but seems to be unsustainable. It has led to the formation of a discounted pennant model that, if materialized, could have a negative impact on the progress made over the past 14 days. On Wednesday, XRP / USD tested the $ 0.25 barrier but was rejected immediately. As mentioned earlier, the support at $ 0.24 helped buyers find a balance.
There is also a continuous eye pushing to $ 0.25. It is essential that a break above $ 0.25 is carried out early to ensure the risk of a break under the pennant pattern has been prevented.
4-hour XRP / USD chart


