The UNI token, from the Uniswap platform , is the leading DEX in the Ethereum ecosystem. It is a governance token, which allows you to vote on the direction the platform will take. It therefore has a fundamental utility. Let’s take a look at what comes out on the charts .
Strong support against Bitcoin

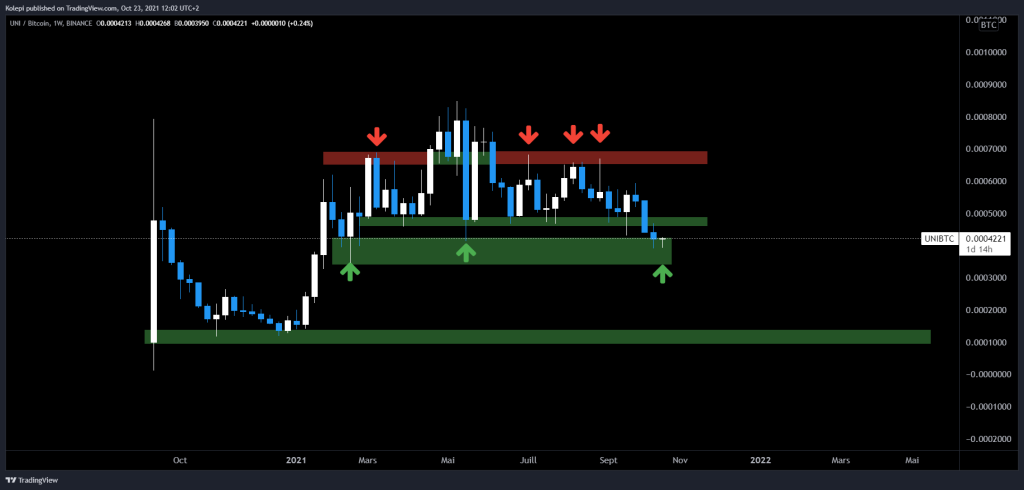
From December 21, 2020, UNI marks a bottom , followed by 140 days of bullish rally, resulting in an explosion of + 650%. A bitcoin crash later, UNI has now been in a channel between 4000 and 7000 satoshis for 126 days. We are currently in a decisive area, which has already served as support several times. The priority to win back is the 5,000 satoshis , which is also an area that has been used multiple times as a support. The objective would be to seek out the already well-known resistance of the 7000 satoshis and see the reaction there. Umpteenth rejection or new ATH?
In a range in Weekly against the USDT

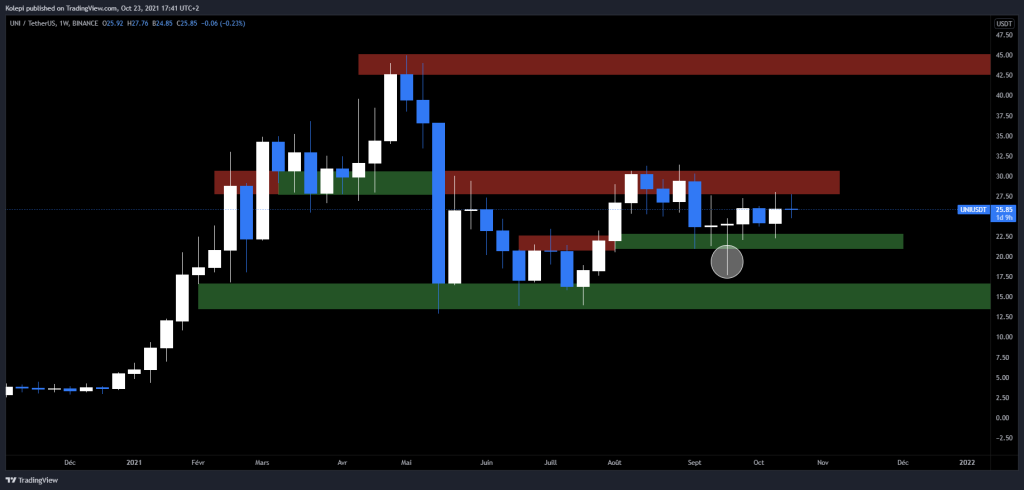
There is a lot to be said for the weekly chart against the USDT. As a first step, the resistance that we are trying to break through right now, that of $ 30, has already served as support and even resistance. We can therefore understand the difficulty of passing this course.
- Hundreds of Bitcoin ATMs are getting installed in Walmart in the US
- Towards a decentralized financial ecosystem: The DEFI
- Pakistan not to ban bitcoin (BTC) and other cryptocurrencies
- Less dollars, more bitcoins, Salvadorans regain control
Secondly, we can observe surrounded in white, a superb wick of completely redeemed liquidity. The manifestation of an obvious “hitchhiking hunt”, in order to purge the long lines started on this support.
A superb daily setup against the USDT

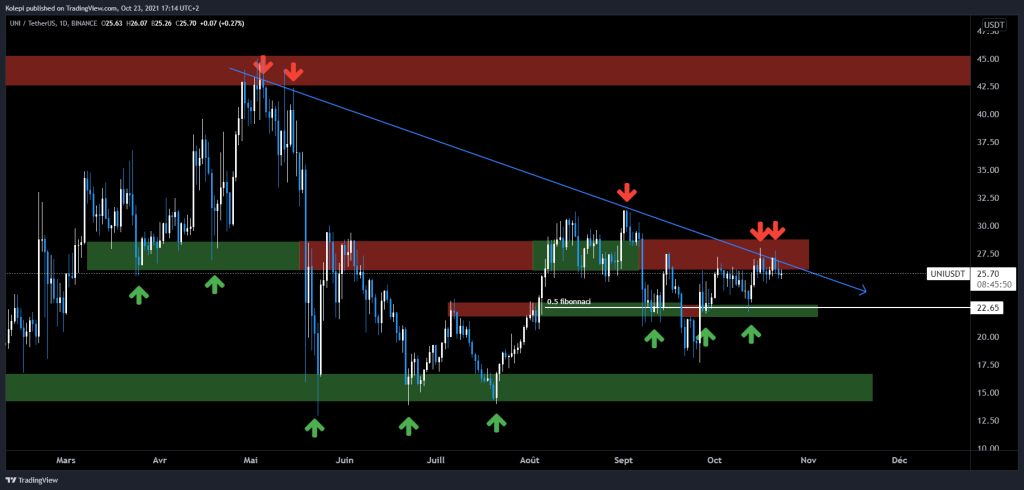
Since the May 2021 crash, the UNI has found itself under the $ 30 resistance it is struggling to break through at the moment. The area to watch is $ 26-28.
Why is this area so important? It has always been the scene of a price reaction, whether in terms of support or as resistance.
Second zone to watch: the $ 22 zone. Indeed it has served as support / resistance on several occasions, in addition to representing the 0.5 of Fibonacci . It is therefore important to keep an eye on this critical area.
The trendline drawn appears to be totally consistent with the rejection of the last few days, there is a confluence of the latter and resistance.
Here we can better dissect the phenomenon of redeemed liquidity that I mentioned in the weekly analysis. In my opinion, this passage below 0.5 Fibonacci was made to scare away the bulls who bought the first rebound in this area.
UNI therefore seems to evolve in a good configuration. The bulls with strong leverage have been sanctioned by this nasty wick of liquidity. I think now is the time for bears to suffer the same fate. The DeFi sector is in an excellent dynamic, taking advantage of the recent acceleration of Bitcoin. However, there is no need to rush to purchase. In recent days several attempts to cross the $ 30 have ended in failure and a pullback is still quite possible.


